
What is Foreign Exchange?
Foreign exchange (Forex or FX) is the cross-country exchange of currencies and is, single handedly, the largest and most liquid financial market in the world. With an estimated $4 trillion in currencies traded in a single day, it eclipses the trading of other types of commodities. Unlike other commodity trading, Forex has no centralised exchange and is traded primarily through banks, brokers, dealers, financial institutions and private individuals.
Due to the ability of financial institutions to trade Forex, the Forex market is open 24 hours, 5 days a week (it closes Saturday morning). Prior to the late 1990’s, Forex trading was only commonplace for institutional traders and even though retail traders had access to trade the Forex market, it has only recently become popular and more common for individuals to trade Forex in an attempt to make a profit.
Most of the world’s currencies are free floating; meaning they retain an individual value and will appreciate and depreciate against other currencies. Currencies are always listed in pairs as they need another currency to benchmark against.
Why would I trade Forex?
Trading Forex has many purposes. There are many levels traded which impact on you that you would not even be aware of. For every purchase you make, the contents, ingredients, by-products, parts or materials may not necessarily all be from a domestic source. Many elements could have been bought internationally, and as such, the exchange of foreign currency would have had to have taken place.
For international importers or exporters of goods and services, there are great opportunities available through having access to the international market. However, with fluctuating international currency rates, payment can sometimes be difficult. Initially companies make a sale for an agreed price, then on the day of payment the agreed value is significantly less than agreed to, due to a currency fluctuation known as “foreign exchange risk”.
You will find all types of businesses, from large financial institutions to small retail freight forwarders will practice foreign exchange hedging. Simply put, these companies will put in place measure to ensure that their agreed payment value will represent the same value at the day of payment, regardless of currency value fluctuations.
The 8 Major Currencies
Internationally, there are 8 currencies that are traded more than other currencies. These are often referred to as “Majors”. These currencies are as follows:
- USD — Unites States Dollar
- JPY — Japanese Yen
- GBP — British Pound
- CAD — Canadian Dollar
- EUR — The Euro
- CHF — Switzerland Dollar
- AUD — Australian Dollar
- NZD — New Zealand Dollar
Trading Hours
Certain parts of the world have part of their Saturday to trade, as it’s still Friday in other markets.
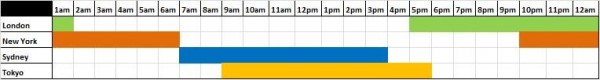
Financial institution in these countries may be dealing with the Forex market during their work hours, the Forex market is open and trading 24 hours, 5 days a week. For someone living in the East Coast of Australia, the market hours for the corresponding markets are outlined below:
- Sydney session starts at 7:00am and ends around 4:00pm
- Tokyo session begins at 9:00am and ends around 6:00am
- London opens at 5:00pm and ends around 2:00am.
- New York session opens at 10:00pm and ends around 7:00am
What is a Currency Pair?
Currency is always measured against another currency and they are referred to as currency pairs. Currency pairs are generally segregated into groups. These groups are known as Majors, Minors and Exotics. Major currency pairs are the most popular traded currency pairs.
Almost all currencies are free floated, meaning that they don’t have a set representation of value to another currency and can rise and fall in value independently.
What is a Pip?
A pip is a small measurement of change in the underlying currency. Generally, it is the forth (0.0001) decimal place of a currency price, except with the Japanese Yen, where they have no denomination for cents in their currency (in the Japanese Yen, the pip is the second decimal place). Shown below is an image representing an order window reflecting the price of the AUD/USD.
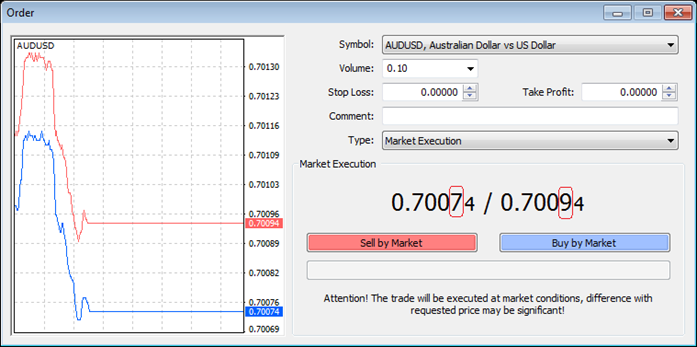
The fourth decimal place is marked red to show which decimal the pip is in reference to. If the price 0.70074 moves to 0.70084 then there was a 1 pip movement.
A pip is a good reference measure to how much a trader can make based on the volume of their trades. For example, if a trader purchases 1 standard contract of AUDUSD, the value of potential return and risk is $10 profit or loss (of the counter currency in a pair) per pip movement. You can follow the table below as a reference to potential risk or return:
Quite often, the annotation used to measure how well a trader is doing is to mention how many “pips” they have gained in a set time period.
What is Bid, Ask and Spread?
With currency quotes, they are always represented with a Bid offer and an Ask offer. This denotes the price difference between buying and selling.
If you BUY, you are buying at the ASK price. If you SELL, you are selling at the BID price. Shown below is a list of currency pairs all showing Bid and Ask prices.
Remember, if you opened a BUY position and you wish to close it, you are essentially SELLING it back, therefore the price you will be closing the position at is the BID price and vice versa.
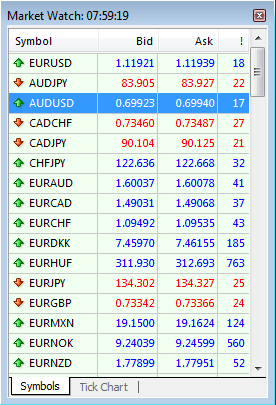
The spread is the pip difference between the BID and ASK. If you were to look at the above image and referred to the AUD/USD then you will notice the BID as 0.69923 and the ASK as 0.69940.
This is a spread of 1.7 pips. 0.69940 – 0.69923 = 0.00017 = 1.7 pips.
What is Leverage?
Leverage is the amount that you are borrowing based on the deposit in your account. Default leverage is set at 100:1, meaning that for every $1 you have in your account, you have a buying power of $100. If you have $1,000 in your account, you have buying power of $100,000.
Something to remember is 1 standard contract is $100,000 of the base currency. If you wanted to trade a full contract and you had leverage of 500:1, then you could take this position with only $200 in your account ($200 x 500 = $100,000). High leverage can help you take larger positions based on smaller capital in your account, but it is not without its pit falls. Larger positions result in larger dollar movements per pip and, as such, can wipe out smaller capital amounts in a short period of time.
Basic Example
We’ve now learnt the basics of Forex trading. So in summary. If you were to choose a currency pair, say for example the AUD/USD and executed a BUY of 2 standard contracts (2.0) at the price of 0.84693.
You would have required a minimum of $2,000 in your account with a leverage of 100:1 to take this position.
At a contract size of 2 standard contracts you will make US$20 per pip movement. The BUY position denotes that if the AUD/USD price appreciates, then you will make money.
Say if the AUD/USD appreciates to 0.84973, you have gained 28 pips, which is a profit of 28 pips x $20 = US$560, which would equate to A$659.
Taking Your First Step
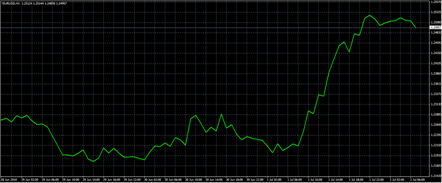
The first time logging in to the MetaTrader 4 platform can be overwhelming. However take the time to have a look at the data available. The market watch window shows current prices for the currency pairs available and the charts give you a timeline based representation of the prices.
Now focus on one particular currency pair. Make a choice, a random one is perfectly fine. Say for example, you have selected the AUD/USD pair. Open an order and you will be presented with the option to “buy” or “sell”. We want to make a random trade now, so execute an order to “buy” or “sell” at market.
You have now placed your first trade on the MetaTrader 4 platform.
You will now see that you have executed a trade. Take a moment to watch how it performs.
After a break, you will notice that your trade has now either taken a profit, or taken a loss.
Regardless of the position of this random trade, you now know how you can make money and, also potentially, how to lose it. Don’t worry if your trade took a loss, this was a random trade and the exercise was to place a trade. Choosing the right directions of trading will come later in developing a strategy.
Having executed this exercise you have completed the first steps towards learning how to trade. You can close this trade if you wish, or you can keep it open and continue to watch it.
Basic Chart Types
If you can’t read the charts, then you won’t make sense of any of the data, with which to form your strategy.
The charts can be placed into three different categories:
- Line Bar Charts
- Bar Charts and
- Candlestick Charts.
Line Bar Charts
The easiest to read of the charts is the Line Bar Chart. It simply shows a line graph of time vs. price.
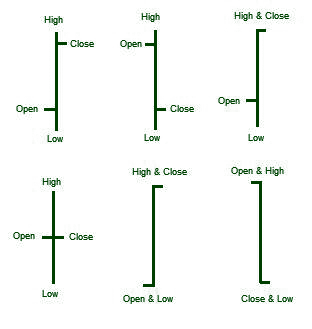
Bar Charts
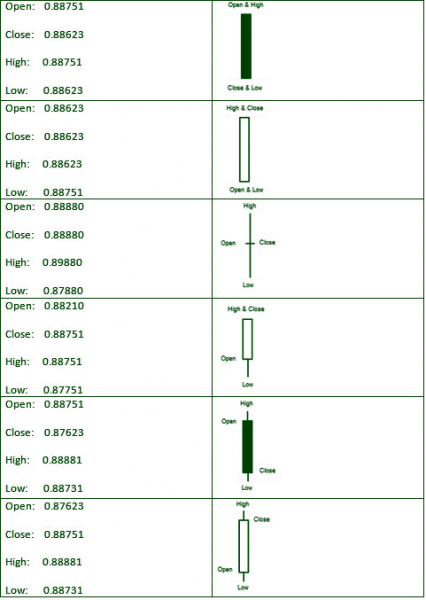
The next chart to decipher is the Bar Chart. Bar charts not only show price, but also show the entry price per period, the exit price at the end of the period and the high and low of that period. Each horizontal line represents one time period. The period is selected by you to represent 1 minute, 5 minutes, 15 minutes, 30 minutes, 1 hour, 4 hours, a day, a week or a month.
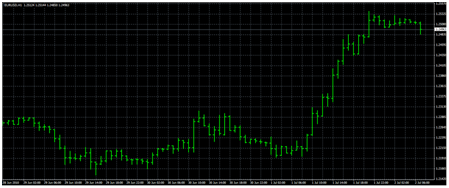
Let’s take a closer look at one of these bars.
Candlestick Charts
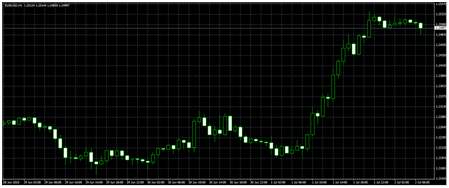
Candlestick charts are similar to bar chart but with additional information of each bar being hollow or coloured. This is done to allow a trader to easily visualise a period bar to have moved in a positive or negative direction from its entry price.
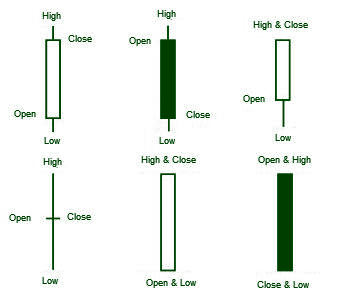
As shown in the image below, the hollow bars are bars that have moved up. Coloured or filled bars are bars that have gone down. The lines that you see above each bar represent the high and lows.
Interpretation of Charts
Now you know what line charts, bar charts and candlestick charts look like, how do you interpret them?
Firstly, you have to understand that these individual bars or candlesticks only represent one time frame. Have a look at the following image to see that each bar represents one hour.
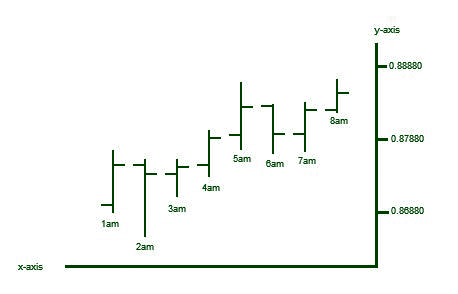
The x -axis represents a time interval and the y-axis represents the currency pair price. Each single bar represents the high and low of that one- hour period, the open price and the close price at the end of the hour. Each bar can be represented in all sizes and lengths.
- Longer bars indicate there were big differences between the high and low.
- Short bars indicate not much movement in the market.
What are Shadows?
When accessing the types of bars or candlesticks, “shadows” is the term given for the portion of the bar or candlesticks where they have reached a high or low, but have not ended the period at the high or low. You will be able to see the shadows of each bar or candlestick where there were highs or lows for that period. In the image below, the shadows are circled in red.
What is Support?
By being able to see the shadows, it gives an indication that the market at that time period may have reached a high, but the market retracted and closed at a lower point. This may show that when the underlying asset (the currency pair) reached a certain point where there was resistance by other market participants in offering a higher price than the high shown.
On the other side, it can be said that there was support in pushing the price in the other direction if you see several shadows in one direction, ie. several consecutive bars or candlesticks with shadows in one direction.
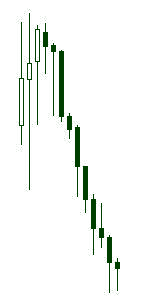
As you can see in the image above, in the filled candlesticks, there are a lot of consecutive shadows going downward. This shows that there are many market participants seeking a lower price.
It shows support for a downward trend for this particular case, however many counter tails in the opposite direction can set up a reversal so care is needed in thinking whether lower tails always equal lower prices.
What is Resistance?
In the following image, you will see that the bars reach a certain high, but seem to struggle to beat a price mark.
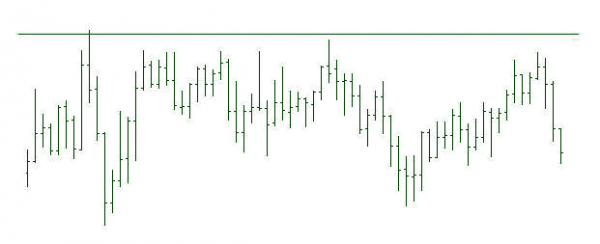
The horizontal line indicates that there is an imaginary level where market participants feel that they should not push the currency past. This is known as resistance.
What are Trend Lines?
Trend lines are lines that are usually drawn on charts to determine a direction the market is moving. A person sitting in front of a chart will physically draw a line from one point to another point to determine the general direction the market is moving.
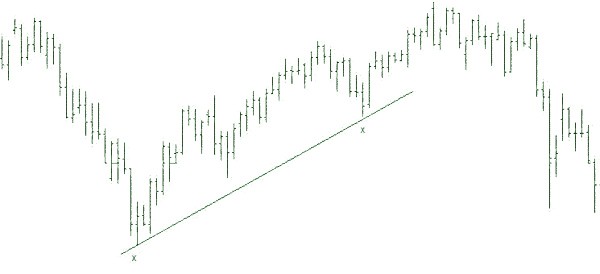
The two “x” points, which the line is following, are the low point of two time periods over a distinct time span. The two points are 36 periods apart (the gap between periods can be any number and not necessarily 36 periods), the trend line was drawn from the two low points at the “x”. The line is a very clear upward trend. Trend lines are useful with trending strategies.
Trend lines are useful to help determine current market direction. To have a confirmed trend support or resistance you need two points to make it a line.
What are Channel Lines?
Channel lines are drawn to show the general direction taking into consideration also any bar “shadows” containing support and resistance.
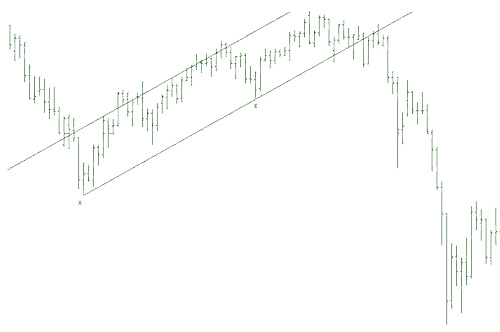
Drawing channels clearly show the channels that trading generally trades between. This is particularly useful when using the “ranging strategy” and also for assessing opportunities for “break out strategies”.
Basic Trading Strategies
Having placed some random trades, you would have figured out that when you place an order to buy or sell, you could potentially earn or lose money. The theory is quite simple, pick the right direction and you will make money. The important question is “how do I pick the right direction?”
The simple truth is that if there was a way to know exactly when to buy and sell, everyone would be rich. Simply put, there is no guaranteed way to always pick the right direction the market moves. However, there are a number of tried and tested strategies that you can base your decision on which can increase your chances of a profitable trade.
Strategies are a systematic and planned course of action based on existing information you know of the market. There are a multitude of strategies for Forex trading. A lot are available to learn for free by doing an internet search. There are also books available and people that will teach these strategies for a fee. Around the world, professional traders and recreational traders alike will always hold at least one trading strategy to heart and will attribute their success in trading to following that one or many trading strategies. The following section covers some popular strategies that are used by many traders.
The Trending Strategy
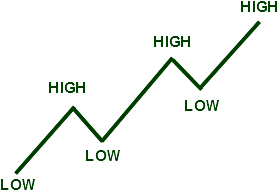
The trending strategy is to follow the market in the direction that it is clearly following over an extended period of time. Currency pairs often take either “bullish” (up) or “bearish” (down) trend.
By following the trend of a particular currency pair, you are banking on the fact that the currency continues its existing direction and you are taking in a profit by following the market direction. This strategy is by far the most popular strategy method for trading currency.
Trends can be long or they can be short, meaning that there are short-term trends and there are long-term trends. An example would be that during a 6-month period, there was a bullish trend for the AUD/USD, however, in between this 6-month period there were 2 short periods where it took a bearish trend. The following is a graphical representation of the example.
If you held a buy position from the start of the 6 months to the end, you would be well in profit. Be careful when you look for your trends. Sometimes when you look at a chart and it shows a very clear trend, if you were to expand your chart to include more data it could very well show you the opposite. As such, if you are looking for trends, make sure you view the time frames of all charts.
The Ranging Strategy
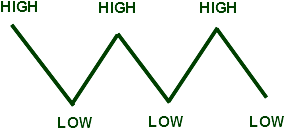
The Ranging Strategy occurs when a currency is trading between a set upper and lower limit and seems to constantly bounce up and down between the high and low limit. Traders take the opportunity to sell when it is at the upper limit and to buy when it is at the lower limit.
Represented in the image below, you will see a sideway trend. This marks the opportunity for people who follow a ranging strategy..
The Breakout Strategy
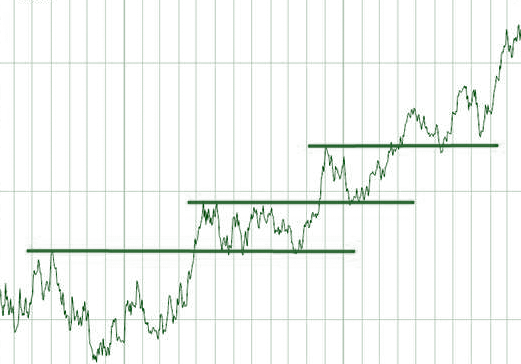
The Breakout Strategy is the break out of a sideway trend. Usually, momentum is greatest on breakout points. A lot of traders take advantage of the breakout strategy when sideways moving prices break the upper or lower limits.
Below represents a few breakouts following some periods of sideways tending.
News Release Trading Strategy
News traders trade off economic news release. The Forex market is particularly reactive to economic news, in particular, interest rate news from the G8 countries, as well as unemployment news for each corresponding country.
News traders will have to bear in mind that the Forex market movements have already taken in to consideration existing and expected economic news. The sharp movements you see due to economic news are corrections due to unexpected news, either better than expected or worse than expected.
Another consideration to take to heart for potential news traders is that during negative sentiment news reports, currency movements generally head towards lower yielding and perceived ‘safer’ currencies; USD and JPY in particular.
A good grasp of economics is generally recommended for traders wishing to start news releasing trading.
An economic news calendar is highly recommended. Forex Economic calendars show the release date for important economic news such as “non-farm payroll”, GDP figures and interest rate news.
Below is an example of what an economic calendar shows.
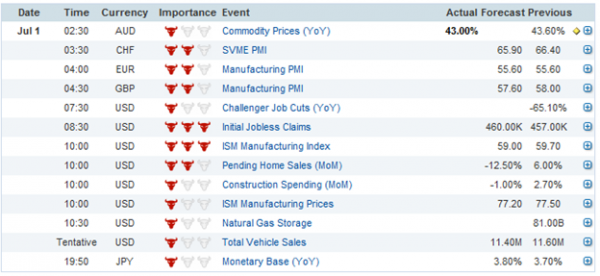
Forex calendars will show what forecasted data should be and what it was previously. If at the news release the actual data released was worse than expected, you can expect the underlying currency of that country to react negatively.
Managing Risk
Trading the Forex market can be profitable, however, it can be just as costly without the proper management over your capital. Generally with each trade, stop losses are placed to ensure that a trade that goes against you does not completely devour your invested capital.
A stop loss is a preset target where your trade will close out. Setting proper stop losses are important to ensure that your losses are minimized. For traders that don’t want to sit in front of their computer every minute they have positions opened, stop losses are your best friend.
Setting the amount you are willing to lose per trade is subjective. Generally, risk levels are set at between 1% and 5% of your trading accounts total balance. This means at a risk level of 5%, you can place 20 losing trades before you lose all your funds. If you find that you often incur losses, you may wish to review your strategy.
Say for example, you deposited an initial amount of $1,000. To risk 2% per trade would be to set a stop loss which will close the trade for you should a single trade lose $20 ($1,000 x 2% = $20).
Make sure that you manage your risk, as this is one of the pivotal aspects in long-term trading success.
Managing your Emotions
Quite often, the greatest opponent you have while trading is not the market but yourself. When trading, greed and fear often limits the potential returns from profiting trades and on the opposite side of the spectrum can result in greater losses than necessary or turn potentially profitable trades into losing trades.
All traders (successful and unsuccessful) can attest to holding on to losing trades for far too long for no other reason than the “hope” that they become positive again. This is otherwise known as being too greedy.
Alternatively, the fear of taking profits too early or closing at a small loss when they can potentially be profitable is also another emotional response that needs to be adjusted. Good traders strictly follow a complete trading plan that incorporates money and risk management, entry, exit rules and do not let emotions influence their trading.
Transitioning from Demo to Live
The transition of when to move from a demo to a live trading account is a question that is often asked by many new traders. Most important is that you have a risk management and trading strategy in place which you are comfortable with.
As great as demo accounts and “play money” is for learning, all too often an emotional detachment is developed to the trading losses incurred on a demo account. You will never develop the keen senses to close out losing trades. It’s all too often that serial demo users lose their account balance and continue to deposit considerable amounts of funds.
Once you feel you have a comfortable grasp of strategy, control over your emotional misgivings to trading, you can begin your live trading with real funds.